


Why look up soil data at all
If you are buying a house in Dallas, comparing foundation proposals, or simply trying to understand why your neighborhood comes up in every conversation about expansive clay, the public mapping is genuinely worth reading.
It will not tell you whether your foundation needs repair. Used properly, it will tell you what the general ground conditions in your area are, which makes you a better-informed participant in the conversation. Our companion guide on how Dallas soils affect foundations covers the behaviour; this one covers the sources.
The authoritative sources
USDA NRCS Web Soil Survey. The primary public source for mapped soil series in the United States. You define an area of interest over your property and generate a report describing the soil units present and their properties.
State and federal geological publications. For bedrock formations such as Eagle Ford Shale, Austin Chalk, and the Taylor Group, the relevant geological surveys publish mapping and explanatory material. These describe rock units rather than surface soils.
Municipal and county records. Permitting history, floodplain mapping, and in some cases geotechnical reports filed for larger developments nearby.
Property-specific geotechnical reports. If one exists for your subdivision or your lot, it is worth considerably more than any regional map, because it reflects borings taken on that ground.
How to read a soil report
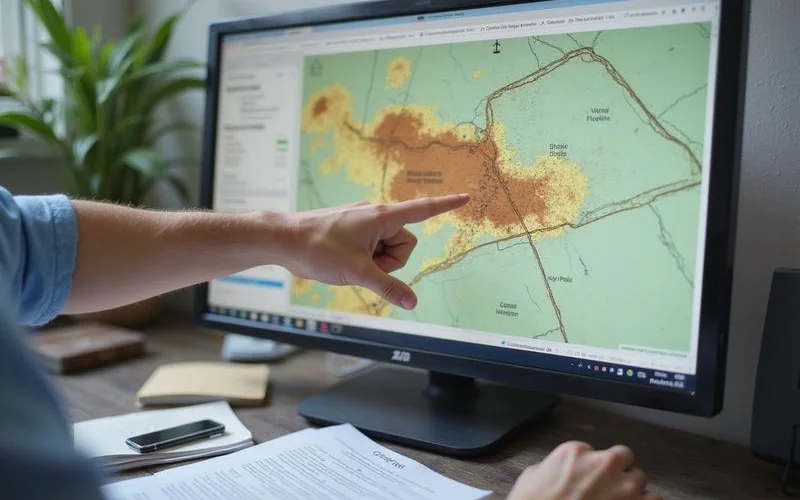
Once you have generated a report, a few fields carry most of the useful information.
Map unit name. The soil series and slope class, for example a Houston Black clay with a stated slope range. This is the headline identification.
Shrink-swell potential. Usually rated qualitatively, from low through high. High is what dominates Blackland Prairie soils.
Plasticity index. A numerical measure of the moisture range over which the soil behaves plastically. Higher values indicate greater volume change potential.
Depth to bedrock and drainage class. Both influence how the ground behaves and what a pier will encounter.
Map unit composition. Worth attention: a map unit is usually described as a dominant soil plus named inclusions. Your lot may sit on an inclusion rather than the dominant type.
Separating what the source says from what it means

This is the discipline that separates useful reading from misleading conclusions.
The source reports something like: this map unit is predominantly Houston Black clay with high shrink-swell potential. That is a statement about mapped soil across an area.
An interpretation is: therefore this house has foundation damage. That is not what the source said, and the source cannot support it.
Keep the two apart in your own notes. When you read a contractor’s website that presents soil data and a repair recommendation as though one followed from the other, you will notice immediately.
A useful habit
Write down the source, the publication or survey date, the geographic scope, and the map scale alongside anything you conclude. If you cannot state those four things, the conclusion is not really sourced.
The limitations that matter most
Scale. Soil surveys are mapped at a resolution suited to regional planning and agriculture. A single map unit can cover many city blocks, and variation within it is normal.
Fill and disturbance. Construction brings in fill, cuts grade, and compacts ground. None of that appears in a survey mapped from natural conditions.
Age. Note the survey date. Series identification is stable; surrounding development is not.
Nothing about your structure. Soil data describes the ground, not the building. It knows nothing about how your foundation was built, how it has been drained, or what has happened to it since.
What to do with the information
Use it as context. If your report shows high shrink-swell potential, that tells you seasonal moisture management is worth taking seriously and that movement questions in your area are common rather than exotic.
Then, if you are seeing symptoms, have the structure measured. An elevation survey at your address answers what the map cannot, and it produces a document you keep. If you are in a transaction, combining a soil report, a repair history, and an independent assessment gives you a genuinely defensible picture rather than a set of inferences stacked on each other.